LAYER 2 / THE ARCHITECTURE — FROM THE ORIGINAL 44-PAGE FRAMEWORK DOCUMENT
The Six Pentagons. The structural model of the enterprise.
Layer 1 names the three functions. Layer 2 is the architecture underneath them: six pentagon systems from the original Business Maximizer® Framework document — the Quantified Enterprise kernel first, then the five systems that move its numbers. Condensed here without the repetition, with the diagrams intact.
SOURCE: THE BUSINESS MAXIMIZER® FRAMEWORK — 44 PAGES. EDITED FOR LENGTH, NOT FOR SUBSTANCE.
The Quantified Enterprise Pentagon
THE FOUNDATIONAL PENTAGON — WHAT EXACTLY ARE WE TRYING TO BUILD?
If you cannot quantify the business you want to build, you cannot systematically build it.
Most entrepreneurs know they want their business to grow. But “growth” is vague. More revenue? More profit? More customers? A bigger team? More freedom for the owner? Without defining what success actually looks like, a business can become bigger without becoming better. The Quantified Enterprise Pentagon turns the entrepreneur’s ambition into a measurable picture of the enterprise they are trying to build — and it sits above the other five pentagons, because they are the systems used to move its numbers.
The objective is not to measure everything. It is to identify the few numbers that tell you whether the business is moving toward the enterprise you intended to build. A Quantified Enterprise replaces “I think we’re doing well” with “Here is where we are. Here is where we’re going. Here is the gap.”
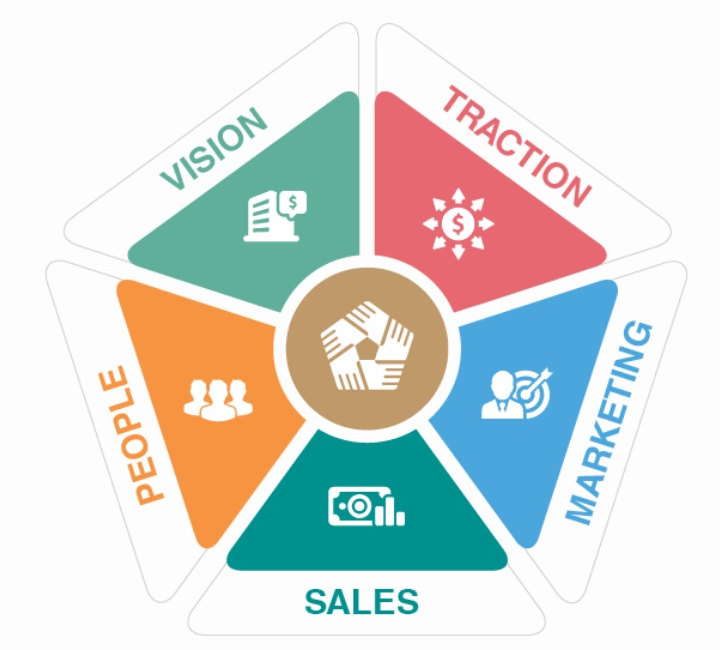
THE FIVE DIMENSIONS
VISION
Where are we going?A vision should not merely inspire people — it should give them a destination. “We want to become the leading company in our industry” is an aspiration nobody can objectively verify. The Quantified Enterprise turns vision into numbers: define a specific future point — three years from today — and quantify the handful of characteristics that best describe the business you want to own. Suddenly the vision is no longer an abstract ambition. It is a destination, and once you have a destination you can work backwards to determine what must happen next.
THE PRINCIPLE — Don’t just visualize your future enterprise. Quantify it.
TRACTION
Are we making measurable progress?Vision tells you where you want to go; traction tells you whether you are actually getting there. A three-year target can feel distant, so the destination is broken into increasingly smaller milestones — a bridge between strategy and execution. The important idea: activity is not the same as traction. Meetings, campaigns, hires and websites are activity. Traction means those activities are producing measurable movement toward the destination. A simple scorecard lets the leadership team answer three questions quickly: Where are we now? Where should we be? Are we ahead, on track, or behind?
3-YEAR VISION → 1-YEAR GOALS → 90-DAY PRIORITIES → MONTHLY TARGETS → WEEKLY ACTIONS
THE PRINCIPLE — Vision without measurement is intention. Vision with measurable progress creates traction.
MARKETING
Can we consistently create demand?Marketing should not simply be something the business does — it should become a measurable system for creating opportunities. Start with the revenue target and work backwards. Now marketing has a number to produce, and stops being a collection of campaigns and starts becoming part of the operating mathematics of the business. Track the few metrics that matter: qualified leads, cost per lead, marketing conversion rate, customer acquisition cost, pipeline generated.
$1,000,000 ADDITIONAL REVENUE ÷ $10,000 AVERAGE CUSTOMER = 100 CUSTOMERS ÷ 25% CLOSE RATE = 400 QUALIFIED OPPORTUNITIES
THE PRINCIPLE — Marketing should not be judged by how busy it looks. Measure how much qualified demand it creates.
SALES
Can we consistently convert demand?If marketing creates opportunity, sales converts that opportunity into revenue — so the sales number never exists in isolation. Work backwards from the revenue target until the target becomes an equation. Then the business can diagnose problems rather than guess: if opportunities are high but sales are low, conversion is the problem; if conversion is strong but revenue is below target, there are not enough opportunities; if customer numbers are strong but revenue is weak, average transaction value is the issue.
THE PRINCIPLE — Revenue is not merely a target. It is the result of an equation you can understand and improve.
PEOPLE
Do we have the capacity to deliver and grow?Every growth plan eventually becomes a people plan. Do not begin by drawing today’s organization chart — start with the future enterprise. If you were already operating the business described in your three-year vision, what would the organization need to look like? Then work backwards: roles required, revenue per employee, customers per employee, capacity per operational employee, critical capability gaps. This prevents the most common growth problem — increasing sales faster than the business can deliver.
MARKETING CREATES DEMAND. SALES CONVERTS DEMAND. PEOPLE FULFIL THE PROMISE. IF THOSE THREE NUMBERS ARE DISCONNECTED, GROWTH DAMAGES THE BUSINESS.
THE PRINCIPLE — Don’t hire for the business you had. Build the capability required for the business you intend to become.
THE MASTER MODEL
This creates something far more useful than a business plan: a mathematical model of your business. And once you have that model, you can ask better questions. Instead of “How do we grow?” — “Which number must change?” Instead of “We need more marketing.” — “We need 80 additional qualified opportunities per month.” Instead of “We had a good quarter.” — “We are 8% ahead of the trajectory required to achieve our three-year vision.”
That is the role of the kernel: the other pentagons are systems you use to move its numbers. The Growth Metrics Pentagon quantifies the marketing and sales metrics one level down — Attention, Acquisition, Revenue, Retention, Referral. The Market Positioning Pentagon defines the WHY, WHO, WHERE, WHAT and WITH behind the demand number. And the Profit Maximizer’s Monitor → Control → Manage → Plan → Improve gets its destination from here.
Quantify the destination. Measure the gap. Build the machine.
Instrument question
Can you state, in numbers, the enterprise you are building — and the gap to it?
The Giver Pentagon
ADAPTED FROM “THE GO-GIVER” — BOB BURG & JOHN DAVID MANN
The Giver Pentagon is built on the principles of “The Go-Giver” by Bob Burg: businesses should be givers, not takers. Provide value to customers first, before asking for anything in return. The five principles keep the business oriented toward delivering value rather than just closing a sale.
Get Committed is the entry condition — commit to putting the customer at the center of every decision, and commit to taking risks, failing small, and rebounding quickly. “Failure is inevitable. Fail small. If you fail, experiment again.” Inspire to Influence replaces discounting with demonstration: your own results, customer testimonials, customer results. Vivacious Value Creator is a measurable standard, not a mood — consistently deliver more value than the customer pays for, found by listening to what they actually need.
Experiment to Enhance is the compounding engine: identify areas for improvement, test, learn from the failures, retest. Improve by 1% a day and the arithmetic does the rest. Ready to Receive closes the loop — stay open to the returns of giving, and build the systems, resources, and support network to handle the success when it arrives. “The key to effective giving is to stay open to receiving.”

THE FIVE PRINCIPLES
The Growth Metrics Pentagon
“WHAT GETS MEASURED GETS IMPROVED.” — PETER DRUCKER
Five KPIs, in sequence. Attention is the first reading: website traffic, social engagement, email open rates — are you capturing the attention of potential customers at all? Acquisition counts new leads and new customers against their cost and lifetime value. Revenue tracks total sales, average sale value, and gross margin — and improves through better customer experience, not just more spend: “If you improve your customer experience, your competition, prices, and profits will become less of a problem.”
Retention measures how many customers keep buying — the metric most owners cannot quote. Referral measures how many new customers arrive through existing ones. In the technology world this is the viral co-efficient, or K-Factor: a co-efficient of 1 means each customer refers one new customer; above 1, growth compounds on its own.
The reference case is Dropbox: a referral program that rewarded users with extra storage for inviting friends grew the service from 100,000 to 4 million users in 15 months — 5900% growth driven by the fifth metric alone. Referral rewards businesses that provide service worth talking about; it cannot be faked with incentives bolted onto a mediocre product.
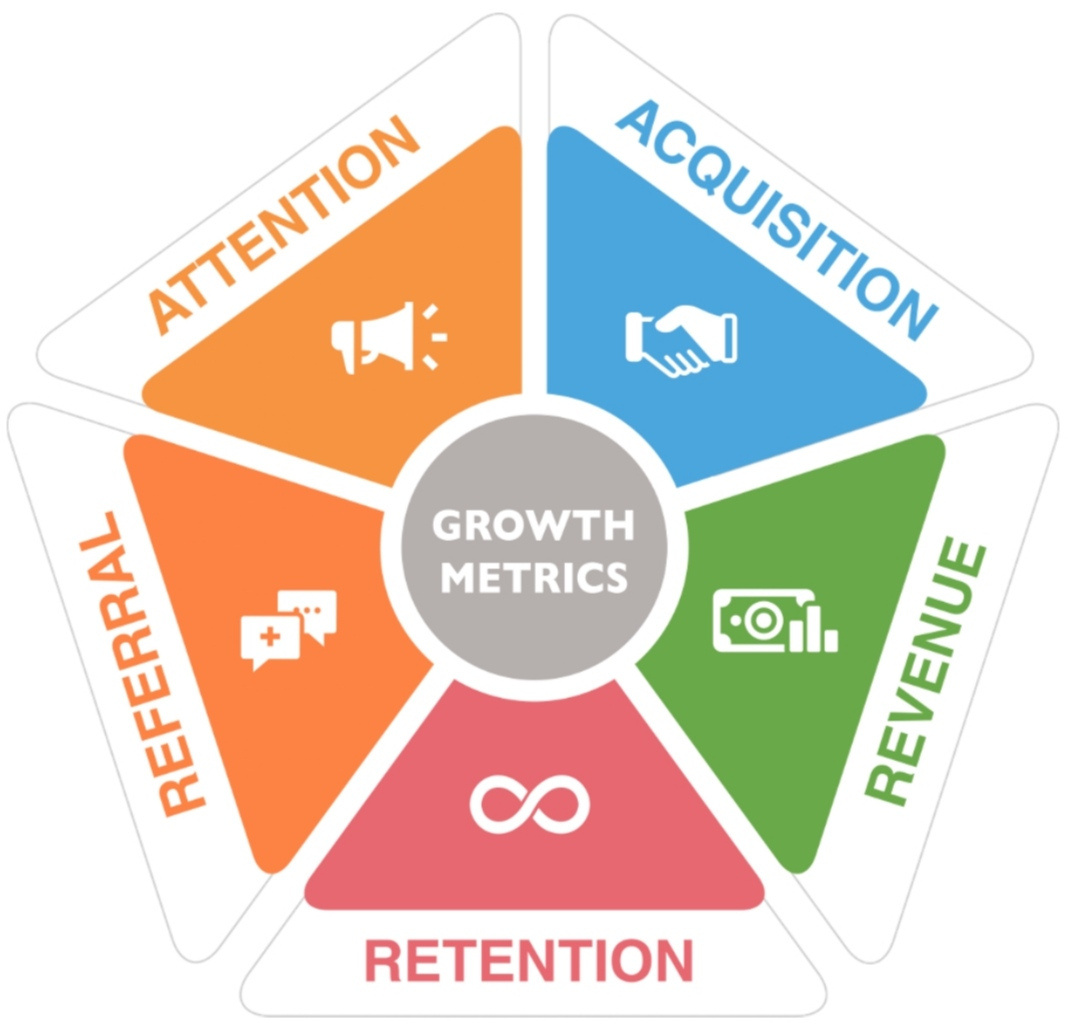
THE FIVE METRICS
The Dot Com Simplified Pentagon
ONLINE GROWTH WITHOUT INFORMATION OR TECHNOLOGY OVERWHELM
Traffic is the first tactic: drive qualified visitors to your website with content worth finding, optimized for search and tailored per platform. Quality over quantity — 100 qualified leads beat 1,000 uninterested ones.
Follow-up is where the money is: “The fortune is in the follow-up.” Eighty percent of sales require five follow-up calls after the meeting, and most businesses stop at one. Track every interaction in a CRM so nothing falls through the cracks, and automate the cadence. Educate comes before Close for a reason: only around 15% of people buy within the first 90 days of being introduced to a product. The other 85% will not buy yet — wrong time, no budget, not enough trust. Pushing for a sale that cannot happen damages the future one; educating builds the relationship that converts later. Sell the worldview and the problem, not the product.
Close converts educated leads through a smooth, credible buying experience — and sells more to existing customers, who already trust you and are far cheaper to serve than new ones. Retain keeps them: stay in touch with personalized communication and offers that match their evolving needs. Retention drives lifetime value, loyalty, and the referrals that feed the next turn of the loop.
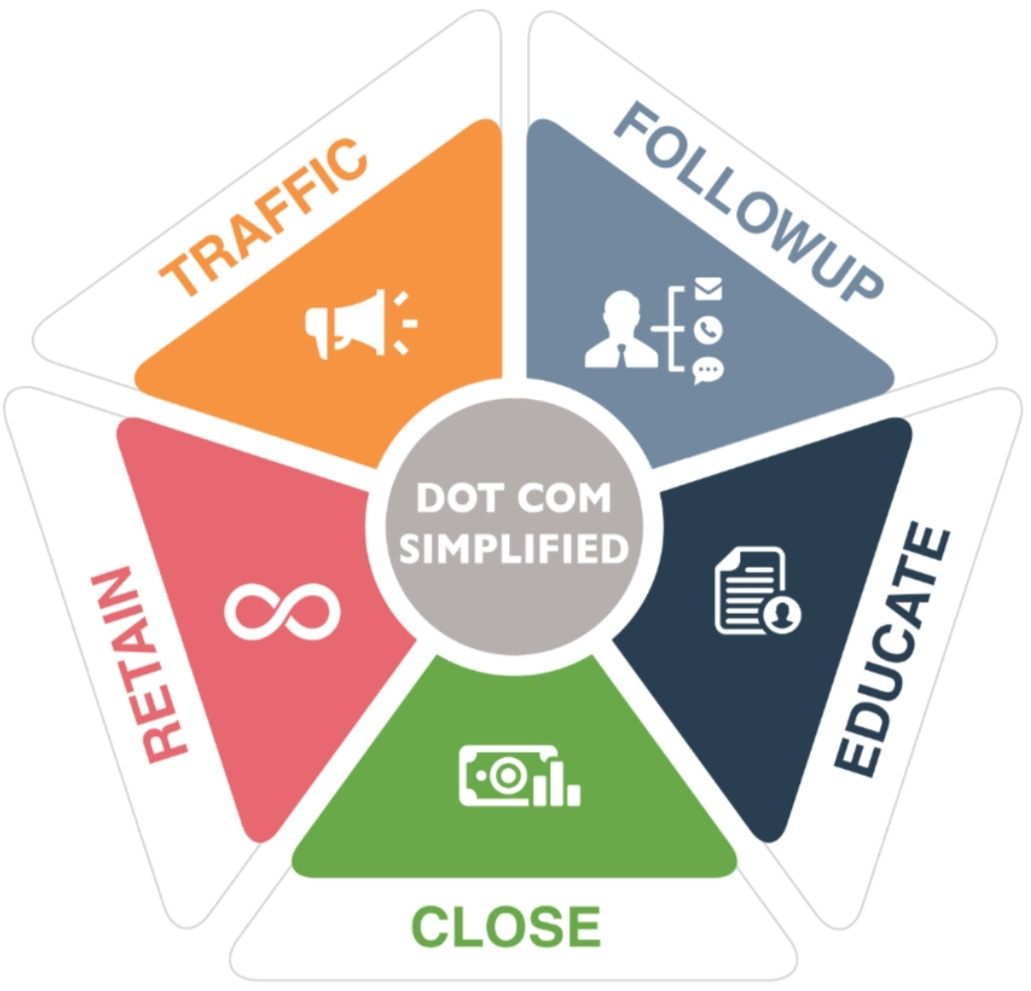
THE FIVE TACTICS
The Market Positioning Pentagon
POSITIONING AS FIVE ANSWERABLE QUESTIONS
Why is the differentiator — the compelling reason a prospect buys from you and not the competition. Find it by studying competitors and distilling a unique value proposition sharp enough to say in one sentence: “Fresh, hot pizza delivered in under 30 minutes, or it’s free.” “When it absolutely, positively, has to be there overnight.”
Who rejects the idea that everybody is your customer. Define the ideal customer precisely — give them a name, map what they see, say, hear, think, and feel. People buy for emotional reasons and justify with logic; the message has to be written from inside their worldview. What picks the single most compelling problem your prospects want solved right now. Your solution should be a painkiller, not a vitamin. With states the solution — but always after the problem. Most advertising leads with the benefit; the 97% of the market not actively buying will not understand why they should care. State the problem first, in all messaging.
Where is a media decision, not a guess: which platforms your ideal customer actually uses, which sites they visit. Knowing the Where stops wasted spend on the wrong channels and opens joint-venture relationships with influencers who already hold the audience.

THE FIVE QUESTIONS
The Profit Maximizer Pentagon
ADAPTED FROM “PROFIT FIRST” — MICHAEL MICHALOWICZ
The Profit Maximizer Pentagon manages the financial resources of the business — budgeting, accounting, cash flow, and financial analysis — on the principles of “Profit First” by Michael Michalowicz. Revenue is allocated into five accounts: Income, Profit, Owner/Shareholder Compensation, Tax, and Operating Expenses. Profit is taken first, not left over.
Monitor tracks the financial KPIs — income statement, balance sheet, cash flow statement, sales, labor and operating costs — so trends surface early. Control runs the allocation discipline: divide revenue into the five accounts consistently, review expenses for reduction, and strengthen internal controls against fraud and error. Manage watches the operating metrics — cash balance, sales, labor productivity, rolling P&L — closely enough to act while a problem is still small. A two-week dip in labor productivity is a cheap fix; a two-year one is not.
Plan builds the forecasting habit: cash-flow forecasting from your P&L history, predicting the costs you can (rent) and controlling the ones you can influence (labor), then checking forecast accuracy against actuals. Improve works the levers that free working capital — receivables collection, inventory levels, supplier terms, employee development, tax planning, and debt management. The output: a business that stays profitable, cash-flow positive, and increasing its working capital.
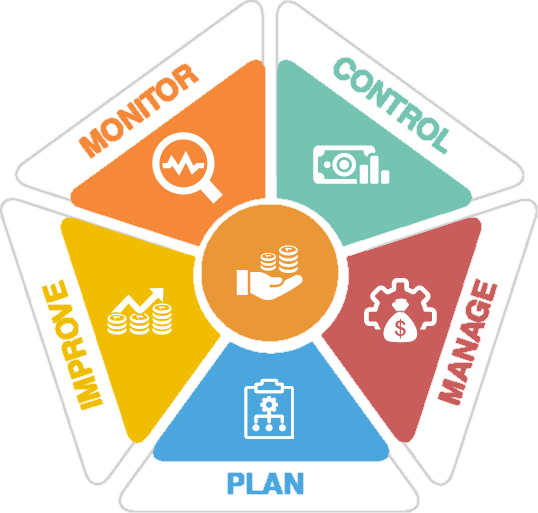
THE FIVE TACTICS
The framework is free. The instruments are installed.
You can run the framework yourself — most owners start here. When the invisible operating system is the problem, that's what BM-OS installs.
The Thirty-Day Diagnostic scores which of the three functions is actually running in your business — with numbers, before any call.